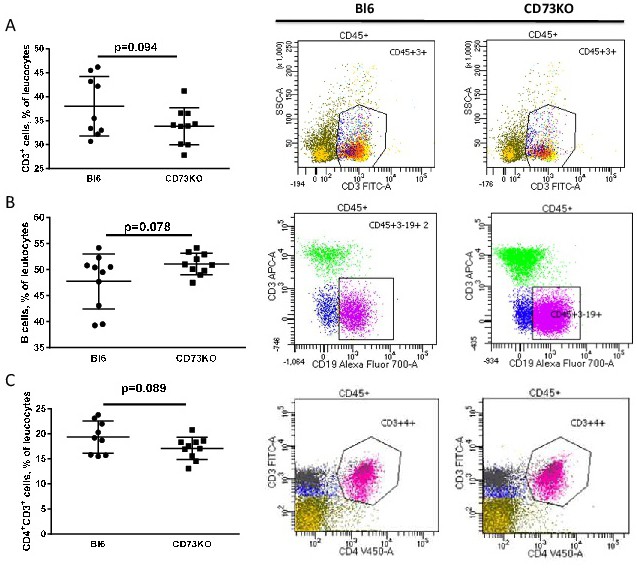
Fig. 2. Influence of CD73-deficience on the different lymphocyte populations. Lymphocytes (A), B cells (B) and CD4+ T cells (C) in spleens of Bl6 and CD73KO mice, presented as a scatter-plot with mean and SD and analyzed with the unpaired T test - left panel. Right panel - representative FACS pictures from Bl6 vs. CD73KO mice.